This case demonstrates the importance of using all available echocardiographic windows for assessing valve function, particularly in the case of unequivocal results regarding the clinical presentation and/or reduced image quality.
A 73-year-old lady was referred to our clinic for evaluation of progressively worsening dyspnoea (lately New York Heart Association [NYHA] grade III) associated with occasional sternal discomfort during exercise. A biological prosthesis (Edwards Magna Model 3000TFX 25 mm) had been implanted in the aortic position 12 years earlier because of degenerative symptomatic severe aortic stenosis of a tricuspid aortic valve. At that time, she had also received a single aortocoronary bypass graft (left internal mammary artery [LIMA] to left anterior descending coronary artery) for single-vessel coronary artery disease.
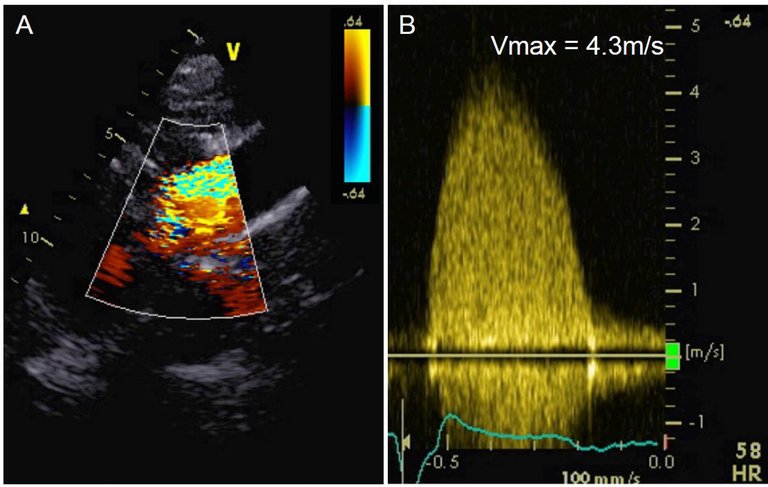
Current echocardiographic assessment of the aortic bioprosthesis showed calcified neo-cusps with reduced systolic opening and a mean systolic pressure gradient of 27 mmHg (corrected for V1 in the left ventricular outflow tract), a maximum systolic flow velocity of 3.4 m/s, a dimensionless index of 0.30, and a calculated effective orifice area (EOA) of 1.1 cm2 (0.6 cm2/m2) from the apical 5 chamber view (fig. 1A and B) [1]. As maximum flow velocities occurring due to aortic stenosis are expected distal of the anatomic orifice, this first imaging window was considered inappropriate, because no colour Doppler signal in the region of the sinus portion could be detected (fig. 1A, circle). After careful re-alignment of the transducer, slightly better visualisation of blood flow distal of the aortic valve was achieved, and a maximum flow velocity of 3.8 m/s could be measured (fig. 1C and D; circle in C indicating visualisation of flow distal of the prosthesis using colour Doppler imaging). We suspected that maximum flow velocity was still underestimated owing to profound ultrasound attenuation in the area distal to the valve when acquiring Doppler signals from an apical transducer position as a result of severe degenerative alterations of the bioprosthetic valve. Therefore, we re-assessed the transvalvular pressure gradient from a right suprasternal position with the patient in a right lateral position. This manoeuvre revealed a mean systolic transvalvular pressure gradient of 43 mmHg with a more parabolic shape of the Doppler spectrum, maximum flow velocity 4.3 m/s, dimensionless index 0.15, and calculated EOA 0.6 cm2 (0.3 cm2/m2); fig. 2). These findings proved the existence of a severe stenosis of the aortic prosthesis and provided a reasonable explanation for the patient’s complaints.
Figure 1
Apical 4 chamber views (A and C) with continuous wave Doppler spectra (B and D) acquired above the aortic value.
Figure 2
Right parasternal view (A) with the corresponding continuous wave Doppler spectrum (B).
A coronary angiogram was performed to exclude progressive coronary artery disease as an alternative explanation for the patient’s symptoms, and revealed an occluded LIMA graft, but patent native coronary arteries; hence, myocardial ischaemia due to macrovascular coronary artery disease was ruled out. Simultaneous pressure measurements in the left ventricle and the aorta confirmed a severe aortic re-stenosis with a mean pressure gradient across the prosthetic aortic valve of 52 mmHg
This case demonstrates the importance of using all available echocardiographic windows for assessing valve function, particularly in the case of unequivocal results regarding the clinical presentation and/or reduced image quality.
Correspondence
Martin Meyer, MD, Department of Cardiology, University Heart Centre, University Hospital Zurich, Rämistrasse 100, CH-8091 Zurich, References