Diagnostic accuracy of transthoracic three-dimensional left ventricular function analysis compared with cardiac magnetic resonance imaging: a bivariate meta-analysis
Owing to the high image quality, accuracy and ability to make three-dimensional measurements, cardiac magnetic resonance imaging (CMR) has become the gold standard method to assess left ventricular ejection fraction (LVEF) and left ventricular volumes [1–3]. However, three-dimensional echocardiography (3DE) has been increasingly recognised as an alternative method to estimate LVEF with increased diagnostic accuracy compared with two-dimensional assessment. So far, a relatively small number of studies have compared the diagnostic concordance of the two diagnostic methods (3DE and CMR) for quantification of systolic left ventricular function, with inconsistent findings in more recent studies. Against this background, we aimed to summarise the available evidence on the diagnostic accuracy of transthoracic 3DE for quantification of LVEF compared with CMR, through a bivariate meta-analysis.
Methods
We developed the protocol according to PRISMA-P [4] and registered it at PROSPERO (CRD42018094137). The manuscript was prepared according to PRISMA diagnostic test accuracy (PRISMA-DTA) guidelines [5]. We conducted a broad computerised literature search of the PubMed, Embase and Cochrane Library databases up to March 2018 to identify studies of prospective design that evaluated systolic left ventricular function in terms of LVEF in adults with 3DE (manual, semi-automated or automated algorithm) in comparison with CMR as the gold standard method. We used the following keywords: three-dimensional echocardiography, cardiac magnetic resonance, left ventricular ejection fraction, left ventricular systolic function. We then constructed 2 × 2 tables at the study level, based on an LVEF threshold of 55%, which contained the number of individuals with LVEF ≥55% based on both methods (true positives), with LVEF <55% based on both methods (true negatives), with LVEF≥55% based only on 3DE (false positives) and with LVEF <55% based only on 3DE (false negatives). Data were extracted at the individual patient level through plot digitisation (Engauge Digitizer 10.4, Mark Mitchell, Torrance, CA) showing the LVEF according to the two methods. We used data acquired with a semi- or fully automated algorithm rather than manual 3DE.
We performed a bivariate random-effects meta-analysis by using a linear mixed model to calculate summary estimates of diagnostic accuracy [6–8]. The bivariate model is for meta-analysing diagnostic studies reporting pairs of sensitivity and specificity [6]..Although traditional diagnostic meta-analysis unifies sensitivity and specificity into one measure (the summary receiver operating characteristic), bivariate meta-analysis maintains their distinct characteristics and takes into account their potentially negative correlation. Preserving the bivariate structure of the data, pairs of sensitivity and specificity are jointly analysed. We calculated summary estimates of sensitivity, specificity, positive likelihood ratio and negative likelihood ratio, and fit a hierarchical summary receiver operating characteristic (HSROC) curve with 95% region of confidence [9]. All analyses were performed in Stata version 15.0.
Results
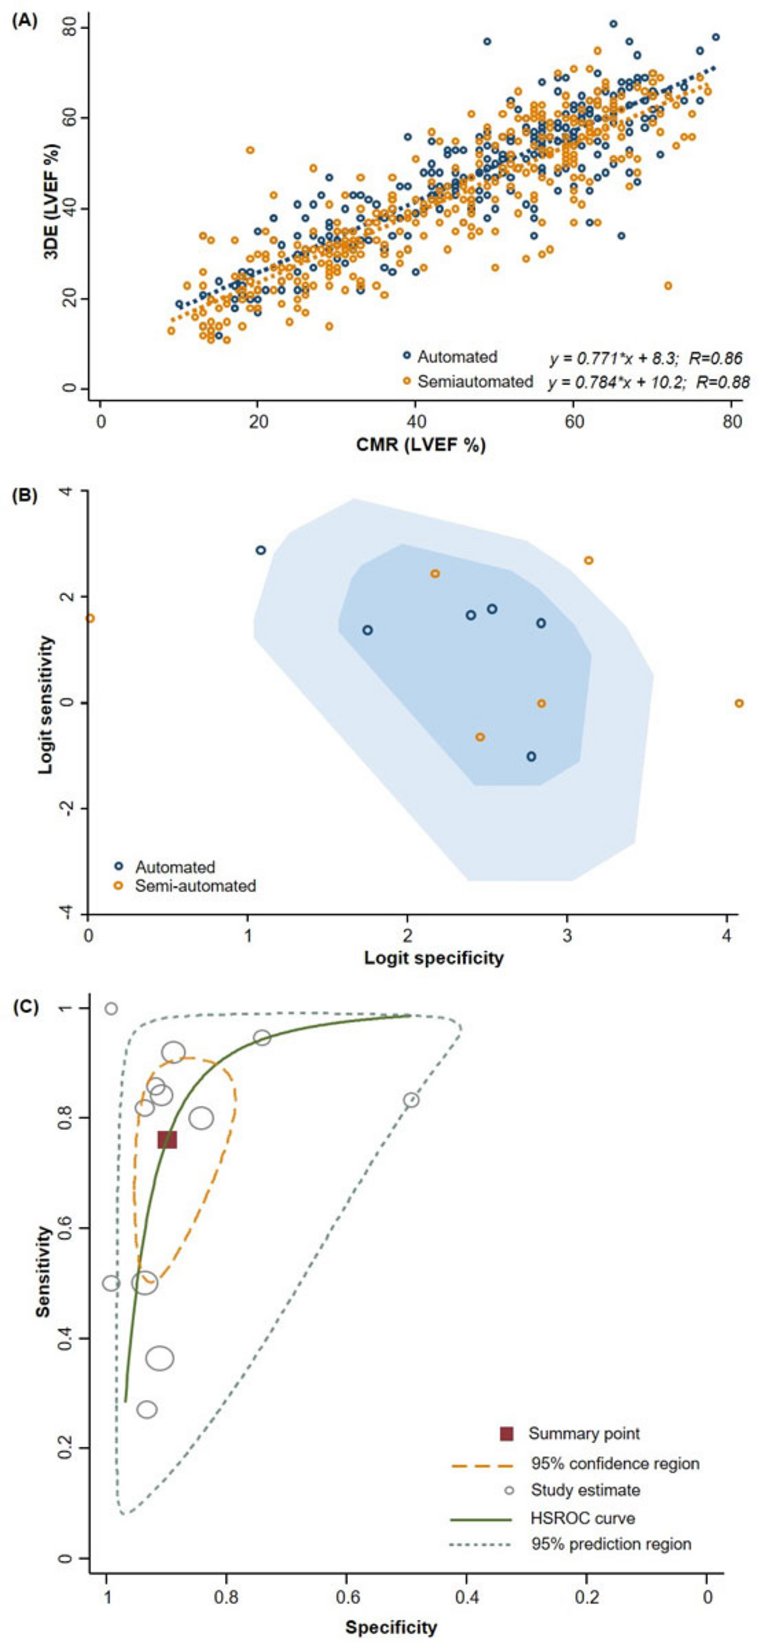
A total of 12 studies were deemed eligible and information on LVEF based on both diagnostic methods were extracted in individual-level for 581 patients (table 1). LVEF was measured with semi-automated 3DE (6 studies, 277 individuals) [10, 11, 13, 15, 18, 20] or fully automated 3DE (6 studies, 304 individuals) [12, 14, 16, 17, 19, 21]. As shown in the figure 1A, diagnostic agreement for LVEF quantification was high between 3DE and CMR (R = 0.88 and R = 0.86 for semi-automated and automated 3DE, respectively). The bivariate box plot in figure 1B describes the degree of interdependence, identifies four outliers at the study level, and demonstrates a skewedness of the 3DE performance measures toward a higher specificity with lower sensitivity. For LVEF quantification based on 3DE, the overall sensitivity and specificity from a bivariate random-effects model were 76% (95% confidence interval [CI] 59–88%) and 91% (95% CI 84–95%), respectively; the diagnostic odds ratio was also high: 32 (95% CI 14–70). The corresponding synthesis of negative likelihood ratio was estimated at 0.26 (95% C, 0.15–0.47), which translates into a fourfold increased chance of correct LVEF quantification based on 3DE in the presence of normal LVEF. Between-study heterogeneity was high (p <0.001 for Q statistic). Also, 3DE showed highly accurate diagnostic performance with an area under the HSROC curve of 0.92 (95% CI 0.90–0.94) (fig. 1C). A stratified analysis according to the LVEF 3DE quantification method yielded similar diagnostic operating characteristics compared with the main analysis for both methods. Finally, the area under the HSROC did not differ after excluding the four outliers studies, which resulted in an area under the HSROC curve of 0.92 (95% CI 0.89–0.94).
Acuson SC2000, Siemens; IE33 Philips; Vivid E9 BT 11, GE
Figure 1A. Correlation plot comparing LVEF quantification with semi-automated 3DE algorithms (six studies [ 9 – 11 , 13 , 15 , 20 ] of 304 individuals) and fully-automated algorithms (six studies [ 12 , 14 , 16 – 18 , 21 ] of 277 individuals) compared with CMR. B. Bivariate box plot with most studies clustering within the median distribution. The inner oval region represents the median distribution of the data points and the outer oval represents the 95% confidence bound. Overall, 4 observations outside the region of 95% confidence bound are flagged as outliers [ 9 , 13 , 17 , 20 ]. C. Hierarchical summary receiver-operating characteristic (HSROC) curve for the diagnostic performance of 3DE to quantify LVEF, among all studies, compared with CMR as the gold standard method. The size of the circles indicates the weight of the individual studies in the meta-analysis. The summary sensitivity and specificity is shown with a red square and the respective 95% confidence region is plotted. For all studies, the area under the HSROC curve was 0.92 (95% CI 0.90–0.94).
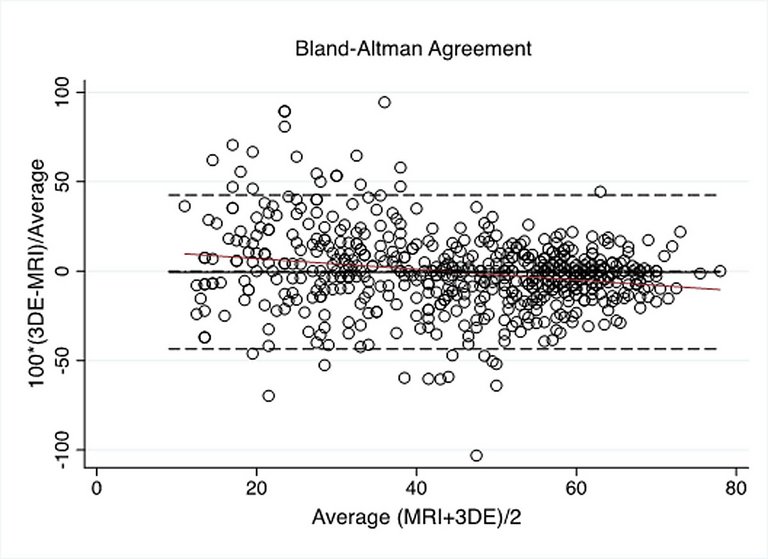
We found a cut-off value of 49% with 3DE to estimate a normal LVEF based on CMR. A Bland-Altman plot of agreement was finally designed to compare 3DE LVEF with LVEF from CMR (fig. 2).
Figure 2
Bland-Altman plot comparing LVEF (%) from 3DE with LVEF (%) from CMR.
Discussion
To our knowledge, this is the first bivariate meta-analysis comparing the diagnostic accuracy of 3DE and CMR in the quantification of left ventricular function solely by including patient-level information. Our findings suggest that transthoracic 3DE for LVEF quantification shows high agreement and diagnostic accuracy compared with CMR, with an area under the HSROC curve exceeding 0.90, irrespective of the algorithm applied (semi- or fully automated). Furthermore, on visual inspection of the correlation plot, we noted a greater agreement between the two diagnostic techniques. This is more pronounced in patients with lower LVEF than those with a higher LVEF. Although this may suggest a lower accuracy with 3DE in the high range of LVEF, this is expected to not have a relevant impact from a clinical standpoint. The latest publications comparing LVEF assessment by 3DE versus CMR often did not show a high diagnostic concordance towards these two modalities, the problem being that 3DE was often seen as underestimating left ventricular volume. Against this background, our meta-analysis showed high diagnostic accuracy of 3DE as compared with CMR.
This study has several limitations. First, we focused on the accuracy between 3DE and CMR in terms of LVEF. Hence the role of other promising indexes, such as the global longitudinal strain, remains to be addressed. Second, we did not formally assess the quality of the studies. Third, we noted high heterogeneity across studies and this could be a result of several factors: the 3D LVEF measurement uses different algorithms depending on the echo machines; semi-automated and automated modes were used to measure LVEF; and the study population was quite heterogeneous, ranging from healthy to severely ill patients from the cardiac point of view. Locally available expertise and the patient’s relevant contraindications for each test should be considered when deciding on the appropriate imaging modality. Lower cost, and broader availability of 3DE allow safe use of the method as an alternative to CMR, especially for follow-up of patients required serial quantification of left vemtricular function.
Data sharing: All data are available upon request.
Correspondence
Raffaele Piccolo, MD, PhD, Division of Cardiology, Department of Advanced Biomedical Sciences, Federico II University of Naples, Via Pansini 5, IT-80131 Naples, raffaele.piccolo[at]unina.it
References
1Camargo GC, Erthal F, Sabioni L, Penna F, Strecker R, Schmidt M, et al.Real-time cardiac magnetic resonance cine imaging with sparse sampling and iterative reconstruction for left-ventricular measures: Comparison with gold-standard segmented steady-state free precession. Magn Reson Imaging. 2017;38:138–44. Published online January 10, 2017. doi:. http://dx.doi.org/10.1016/j.mri.2017.01.002PubMed
2Sudarski S, Henzler T, Haubenreisser H, Dösch C, Zenge MO, Schmidt M, et al.Free-breathing Sparse Sampling Cine MR Imaging with Iterative Reconstruction for the Assessment of Left Ventricular Function and Mass at 3.0 T. Radiology. 2017;282(1):74–83. Published online July 12, 2016. doi:. http://dx.doi.org/10.1148/radiol.2016151002PubMed
3Mitchell C, Rahko PS, Blauwet LA, Canaday B, Finstuen JA, Foster MC, et al.Guidelines for Performing a Comprehensive Transthoracic Echocardiographic Examination in Adults: Recommendations from the American Society of Echocardiography. J Am Soc Echocardiogr. 2019;32(1):1–64. Published online October 05, 2018. doi:. http://dx.doi.org/10.1016/j.echo.2018.06.004PubMed
4Moher D, Shamseer L, Clarke M, Ghersi D, Liberati A, Petticrew M, et al.; PRISMA-P Group. Preferred reporting items for systematic review and meta-analysis protocols (PRISMA-P) 2015 statement. Syst Rev. 2015;4(1):1. doi:. http://dx.doi.org/10.1186/2046-4053-4-1PubMed
5McInnes MDF, Moher D, Thombs BD, McGrath TA, Bossuyt PM, Clifford T, et al.; the PRISMA-DTA Group. Preferred Reporting Items for a Systematic Review and Meta-analysis of Diagnostic Test Accuracy Studies: The PRISMA-DTA Statement. JAMA. 2018;319(4):388–96. Published online January 25, 2018. doi:. http://dx.doi.org/10.1001/jama.2017.19163PubMed
6Reitsma JB, Glas AS, Rutjes AW, Scholten RJ, Bossuyt PM, Zwinderman AH. Bivariate analysis of sensitivity and specificity produces informative summary measures in diagnostic reviews. J Clin Epidemiol. 2005;58(10):982–90. Published online September 20, 2005. doi:. http://dx.doi.org/10.1016/j.jclinepi.2005.02.022PubMed
7Wang F, Gatsonis CA. Hierarchical models for ROC curve summary measures: design and analysis of multi-reader, multi-modality studies of medical tests. Stat Med. 2008;27(2):243–56. Published online March 07, 2007. doi:. http://dx.doi.org/10.1002/sim.2828PubMed
8Chu H, Cole SR. Bivariate meta-analysis of sensitivity and specificity with sparse data: a generalized linear mixed model approach. J Clin Epidemiol. 2006;59(12):1331–2, author reply 1332–3. Published online November 14, 2006. doi:. http://dx.doi.org/10.1016/j.jclinepi.2006.06.011PubMed
9Arends LR, Hamza TH, van Houwelingen JC, Heijenbrok-Kal MH, Hunink MG, Stijnen T. Bivariate random effects meta-analysis of ROC curves. Med Decis Making. 2008;28(5):621–38. Published online July 02, 2008. doi:. http://dx.doi.org/10.1177/0272989X08319957PubMed
10Kühl HP, Schreckenberg M, Rulands D, Katoh M, Schäfer W, Schummers G, et al.High-resolution transthoracic real-time three-dimensional echocardiography: quantitation of cardiac volumes and function using semi-automatic border detection and comparison with cardiac magnetic resonance imaging. J Am Coll Cardiol. 2004;43(11):2083–90. Published online June 03, 2004. doi:. http://dx.doi.org/10.1016/j.jacc.2004.01.037PubMed
11Pouleur AC, le Polain de Waroux JB, Pasquet A, Gerber BL, Gérard O, Allain P, et al.Assessment of left ventricular mass and volumes by three-dimensional echocardiography in patients with or without wall motion abnormalities: comparison against cine magnetic resonance imaging. Heart. 2008;94(8):1050–7. doi:. http://dx.doi.org/10.1136/hrt.2007.123711PubMed
12Thavendiranathan P, Liu S, Verhaert D, Calleja A, Nitinunu A, Van Houten T, et al.Feasibility, accuracy, and reproducibility of real-time full-volume 3D transthoracic echocardiography to measure LV volumes and systolic function: a fully automated endocardial contouring algorithm in sinus rhythm and atrial fibrillation. JACC Cardiovasc Imaging. 2012;5(3):239–51. Published online March 17, 2012. doi:. http://dx.doi.org/10.1016/j.jcmg.2011.12.012PubMed
13Moceri P, Doyen D, Bertora D, Cerboni P, Ferrari E, Gibelin P. Real time three-dimensional echocardiographic assessment of left ventricular function in heart failure patients: underestimation of left ventricular volume increases with the degree of dilatation. Echocardiography. 2012;29(8):970–7. Published online May 09, 2012. doi:. http://dx.doi.org/10.1111/j.1540-8175.2012.01707.xPubMed
14Shibayama K, Watanabe H, Iguchi N, Sasaki S, Mahara K, Umemura J, et al.Evaluation of automated measurement of left ventricular volume by novel real-time 3-dimensional echocardiographic system: Validation with cardiac magnetic resonance imaging and 2-dimensional echocardiography. J Cardiol. 2013;61(4):281–8. Published online March 08, 2013. doi:. http://dx.doi.org/10.1016/j.jjcc.2012.11.005PubMed
15Driessen MM, Kort E, Cramer MJ, Doevendans PA, Angevaare MJ, Leiner T, et al.Assessment of LV ejection fraction using real-time 3D echocardiography in daily practice: direct comparison of the volumetric and speckle tracking methodologies to CMR. Neth Heart J. 2014;22(9):383–90. doi:. http://dx.doi.org/10.1007/s12471-014-0577-1PubMed
16Tsang W, Salgo IS, Medvedofsky D, Takeuchi M, Prater D, Weinert L, et al.Transthoracic 3D Echocardiographic Left Heart Chamber Quantification Using an Automated Adaptive Analytics Algorithm. JACC Cardiovasc Imaging. 2016;9(7):769–82. Published online June 20, 2016. doi:. http://dx.doi.org/10.1016/j.jcmg.2015.12.020PubMed
17Levy F, Dan Schouver E, Iacuzio L, Civaia F, Rusek S, Dommerc C, et al.Performance of new automated transthoracic three-dimensional echocardiographic software for left ventricular volumes and function assessment in routine clinical practice: Comparison with 3 Tesla cardiac magnetic resonance. Arch Cardiovasc Dis. 2017;110(11):580–9. Published online June 02, 2017. doi:. http://dx.doi.org/10.1016/j.acvd.2016.12.015PubMed
18Tamborini G, Piazzese C, Lang RM, Muratori M, Chiorino E, Mapelli M, et al.Feasibility and Accuracy of Automated Software for Transthoracic Three-Dimensional Left Ventricular Volume and Function Analysis: Comparisons with Two-Dimensional Echocardiography, Three-Dimensional Transthoracic Manual Method, and Cardiac Magnetic Resonance Imaging. J Am Soc Echocardiogr. 2017;30(11):1049–58. Published online September 17, 2017. doi:. http://dx.doi.org/10.1016/j.echo.2017.06.026PubMed
19Muraru D, Cecchetto A, Cucchini U, Zhou X, Lang RM, Romeo G, et al.Intervendor Consistency and Accuracy of Left Ventricular Volume Measurements Using Three-Dimensional Echocardiography. J Am Soc Echocardiogr. 2018;31(2):158–168.e1. doi:. http://dx.doi.org/10.1016/j.echo.2017.10.010PubMed
20Mor-Avi V, Jenkins C, Kühl HP, Nesser HJ, Marwick T, Franke A, et al.Real-time 3-dimensional echocardiographic quantification of left ventricular volumes: multicenter study for validation with magnetic resonance imaging and investigation of sources of error. JACC Cardiovasc Imaging. 2008;1(4):413–23. Published online April 10, 2009. doi:. http://dx.doi.org/10.1016/j.jcmg.2008.02.009PubMed
21Aurich M, André F, Keller M, Greiner S, Hess A, Buss SJ, et al.Assessment of left ventricular volumes with echocardiography and cardiac magnetic resonance imaging: real-life evaluation of standard versus new semiautomatic methods. J Am Soc Echocardiogr. 2014;27(10):1017–24. Published online August 19, 2014. doi:. http://dx.doi.org/10.1016/j.echo.2014.07.006PubMed